Location Quotient Data
What does Industry Location Quotient data tell us?
Industry LQ is a way of quantifying how concentrated an industry is a region compared to a larger geographic area, such as a state or nation.
The basic applications of industry LQs include to:
- determine which industries make the regional economy unique.
- identify the “export orientation” of an industry and identify the most export-oriented industries in the region.
- identify emerging export industries beginning to bring money into the region.
Industry LQs are calculated by comparing the industry’s share of regional employment with its share of national employment.
Industries with high LQ are typically (but not always) export-oriented industries, which are importantbecause they bring money into the region, rather than simply circulating money that is already in the region (as most retail stores and restaurants do). Industries which have both high LQ and relatively high total job numbers typically form a region’s economic base. Economic developers and government officials need to pay particular attention to these industries not only for the jobs they provide, but also for their multiplier effect—the jobs they create in other dependent industries like retail trade and food services.
A location quotient generally between the values of 0.85 and 1.20 potentially indicates the community is self-sufficient in that industry. A location quotient less than 1 suggests the community is not self sufficient and may be able to supply locally what it previously imported.

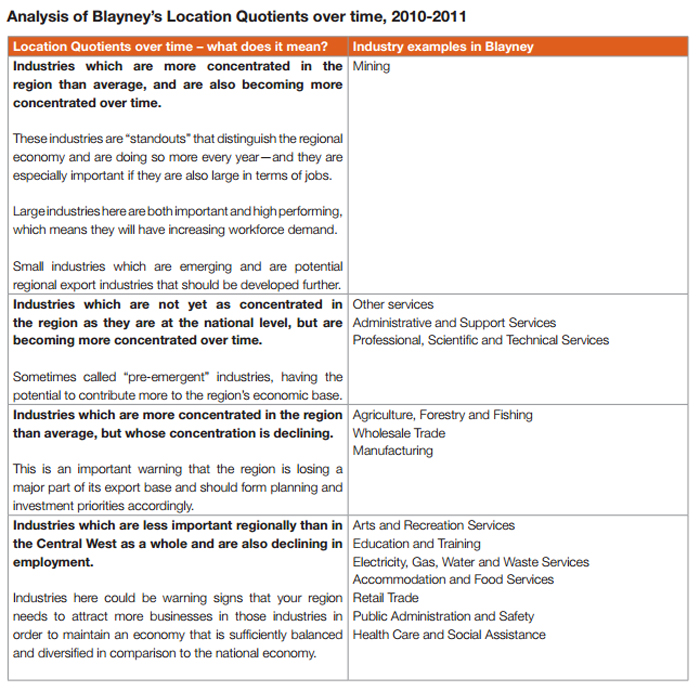
What does Blayney’s Location Quotient data tell us and what opportunities does it present?
Location Quotients over 1.2
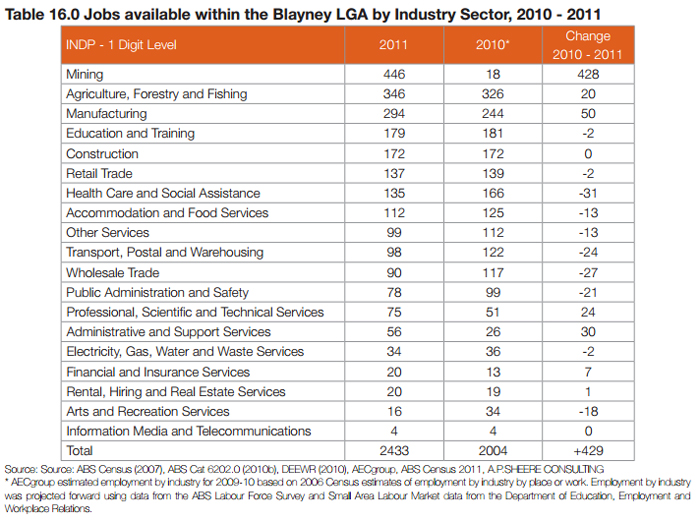
Table 16.0 above illustrates that the sectors with location quotients over 1.2 in 2011 were:
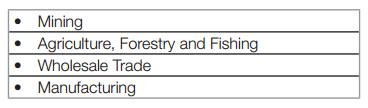
These sectors are well represented in the region providing competitive advantage in the areas of economies of scale and availability of the workforce. These sectors provided 1,176 local jobs or 48% of the total local jobs available in Blayney representing major employment in terms of job numbers within the region.
Location Quotients less than 0.85
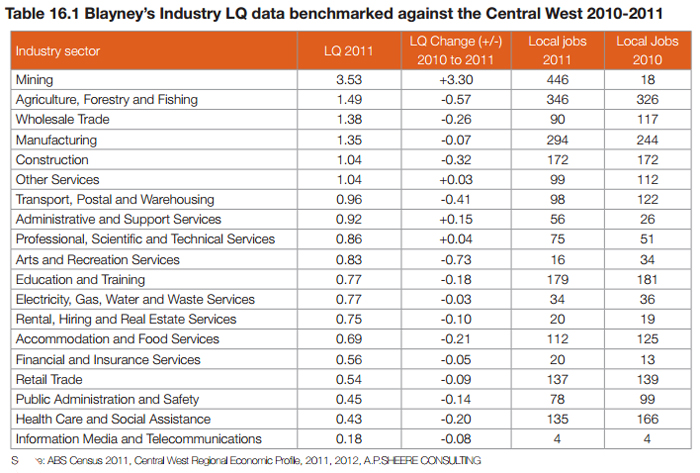
Sectors listed with Location Quotients of less than 0.85 in 2011 highlighting potential opportunities for growth and local industry support to bolster declining sectors were:

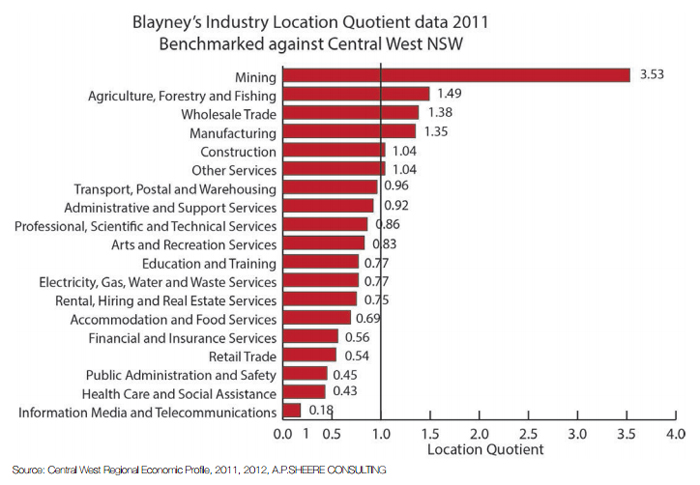
2011 Location Quotients for Blayney LGA
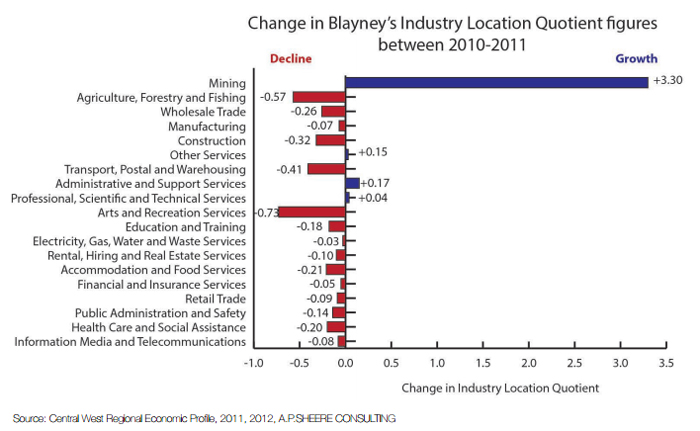
The Location Quotients for 2011 have been graphically represented:
Change in Industry Location Quotients over time
The sectors showing the most growth in LQ between 2010 and 2011 were Mining and Public Administrative and Support Services. The sectors which experienced the greatest decline in LQ between 2010 and 2011 were Arts and Recreation Services and Agriculture, Forestry and Fishing.
Last modified:
30 Sep 2014